Pulse Analytics.
Turning a wall of numbers into decisions marketing teams actually make.
What needed to change.
Pulse Analytics had powerful data infrastructure but a dashboard that required a data analyst to interpret. Marketing managers — the actual end users — were exporting data to Excel to make sense of it.
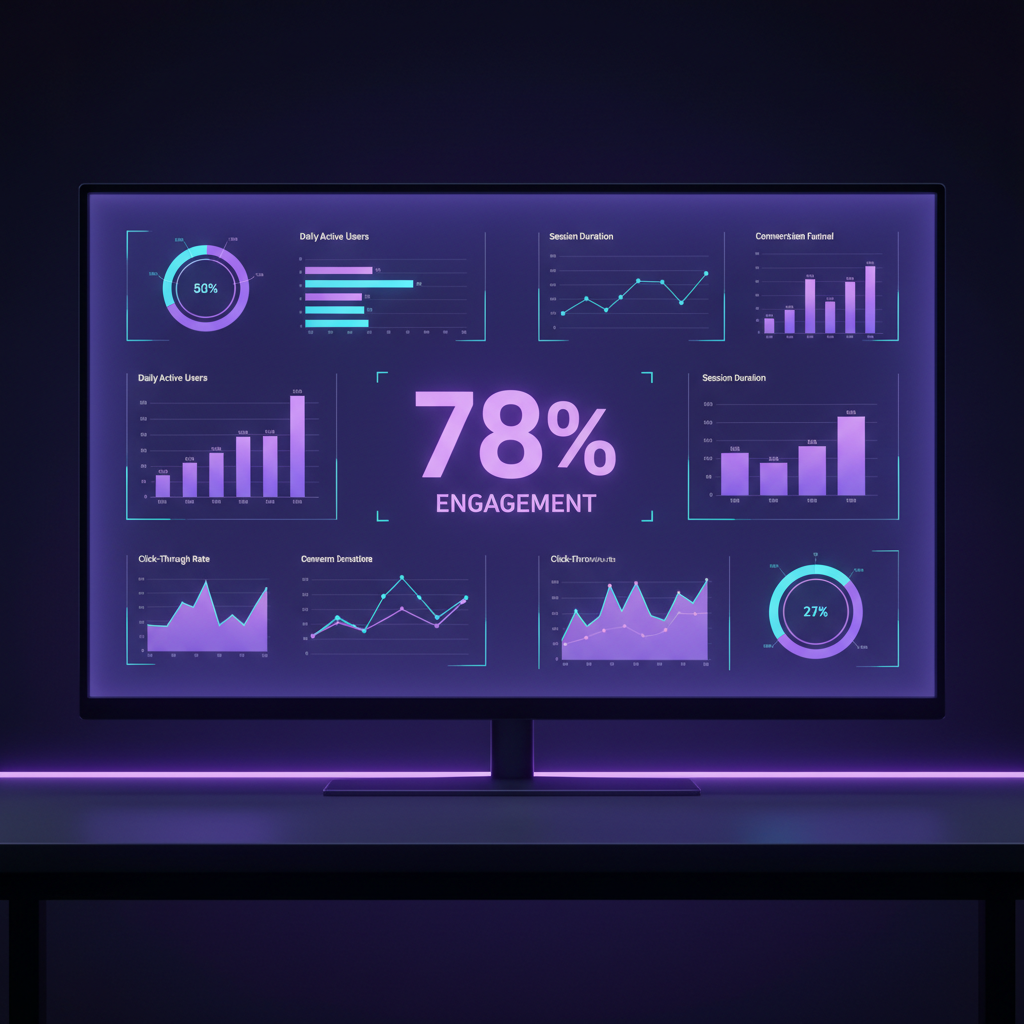
The existing dashboard showed everything at once — 40+ metrics on a single screen, no hierarchy, no narrative. Users spent more time understanding the dashboard than acting on it. The product team needed a redesign that would make the data tell a story, not just display numbers.
How we got there.
Usage Analysis
Analyzed 3 months of product usage data. Discovered that 78% of users looked at the same 4 metrics every session, and 91% of Excel exports contained only those same 4 metrics. The dashboard was showing 40 metrics when users needed 4.
- —Usage analysis report
- —Feature adoption heatmap
- —Export pattern analysis
Goal-Based Research
Interviewed 16 marketing managers about their weekly decision-making process. Mapped the questions they were trying to answer — not the metrics they were looking at. Built a "question-to-metric" mapping that became the foundation for the new IA.
- —Decision-making journey maps
- —Question-to-metric mapping
- —User goal taxonomy
Narrative Dashboard Design
Designed a "Weekly Pulse" view that answered 3 questions: What changed? Why did it change? What should I do about it? Each section was designed to be scannable in under 10 seconds, with drill-down available for each insight.
- —Dashboard concept sketches
- —Narrative framework
- —Information hierarchy spec
Data Visualization Library
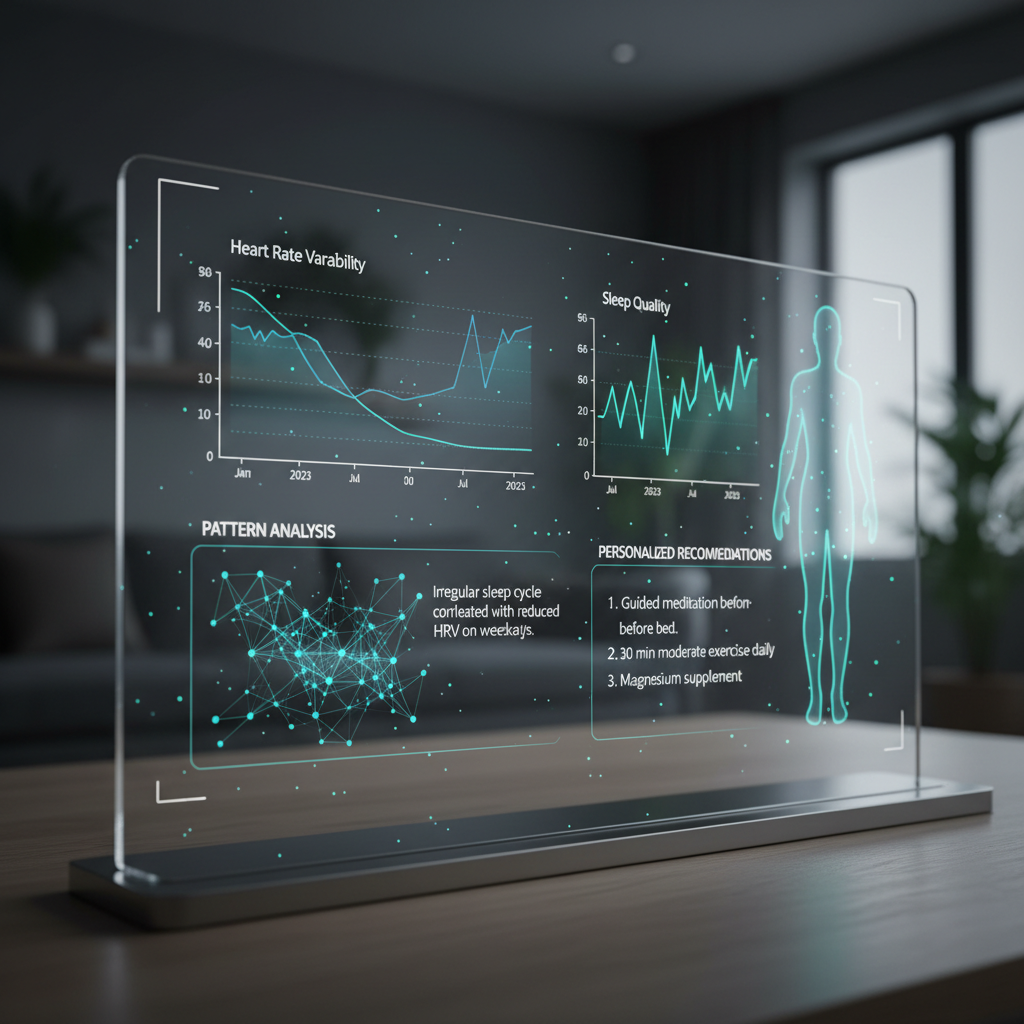
Designed a custom chart library optimized for marketing data — trend lines with anomaly highlighting, comparison charts with clear winners/losers, and funnel visualizations that showed where users were dropping off.
- —Chart component library
- —Data visualization guidelines
- —Accessibility specifications
Testing & Refinement
Ran task-based usability tests measuring time-to-insight for 5 common marketing questions. Iterated on the "Weekly Pulse" summary 4 times until 90% of participants could answer all 5 questions in under 2 minutes.
- —Usability test report
- —Time-to-insight benchmarks
- —Final design specifications
A narrative-first dashboard that surfaced the 3 most important signals for each user's goals, with drill-down capability for analysts who needed depth, and a "what happened this week" summary that could be read in 30 seconds.
Weekly Pulse Summary
The new dashboard opens with a "Weekly Pulse" — a 30-second read that answers what changed, why it changed, and what to do about it. It's designed to be the first thing a marketing manager reads on Monday morning, not a screen they need to decode.
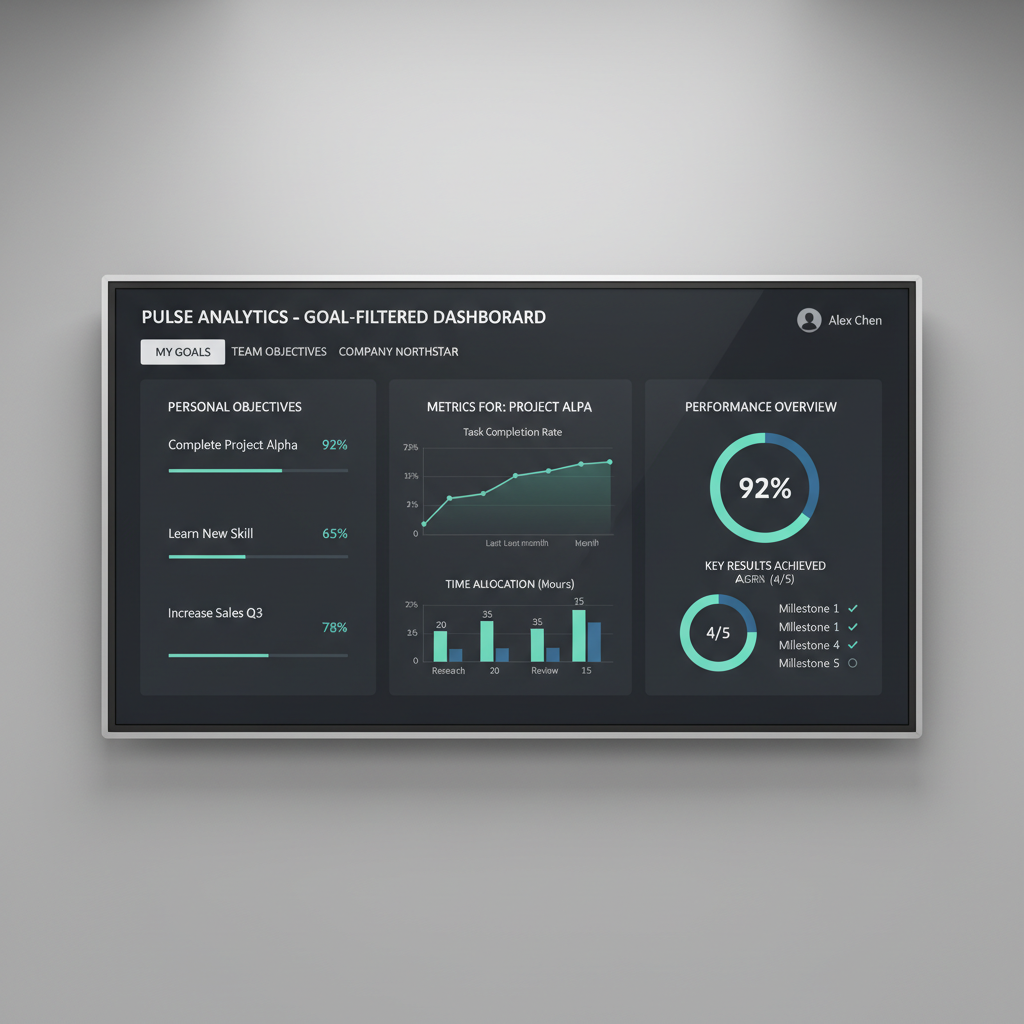
Goal-Filtered Metrics
Users set their top 3 goals during onboarding. The dashboard surfaces only the metrics relevant to those goals by default. Analysts can switch to "full view" for all 40+ metrics — but the default is always the 4 that matter.